pulse-top
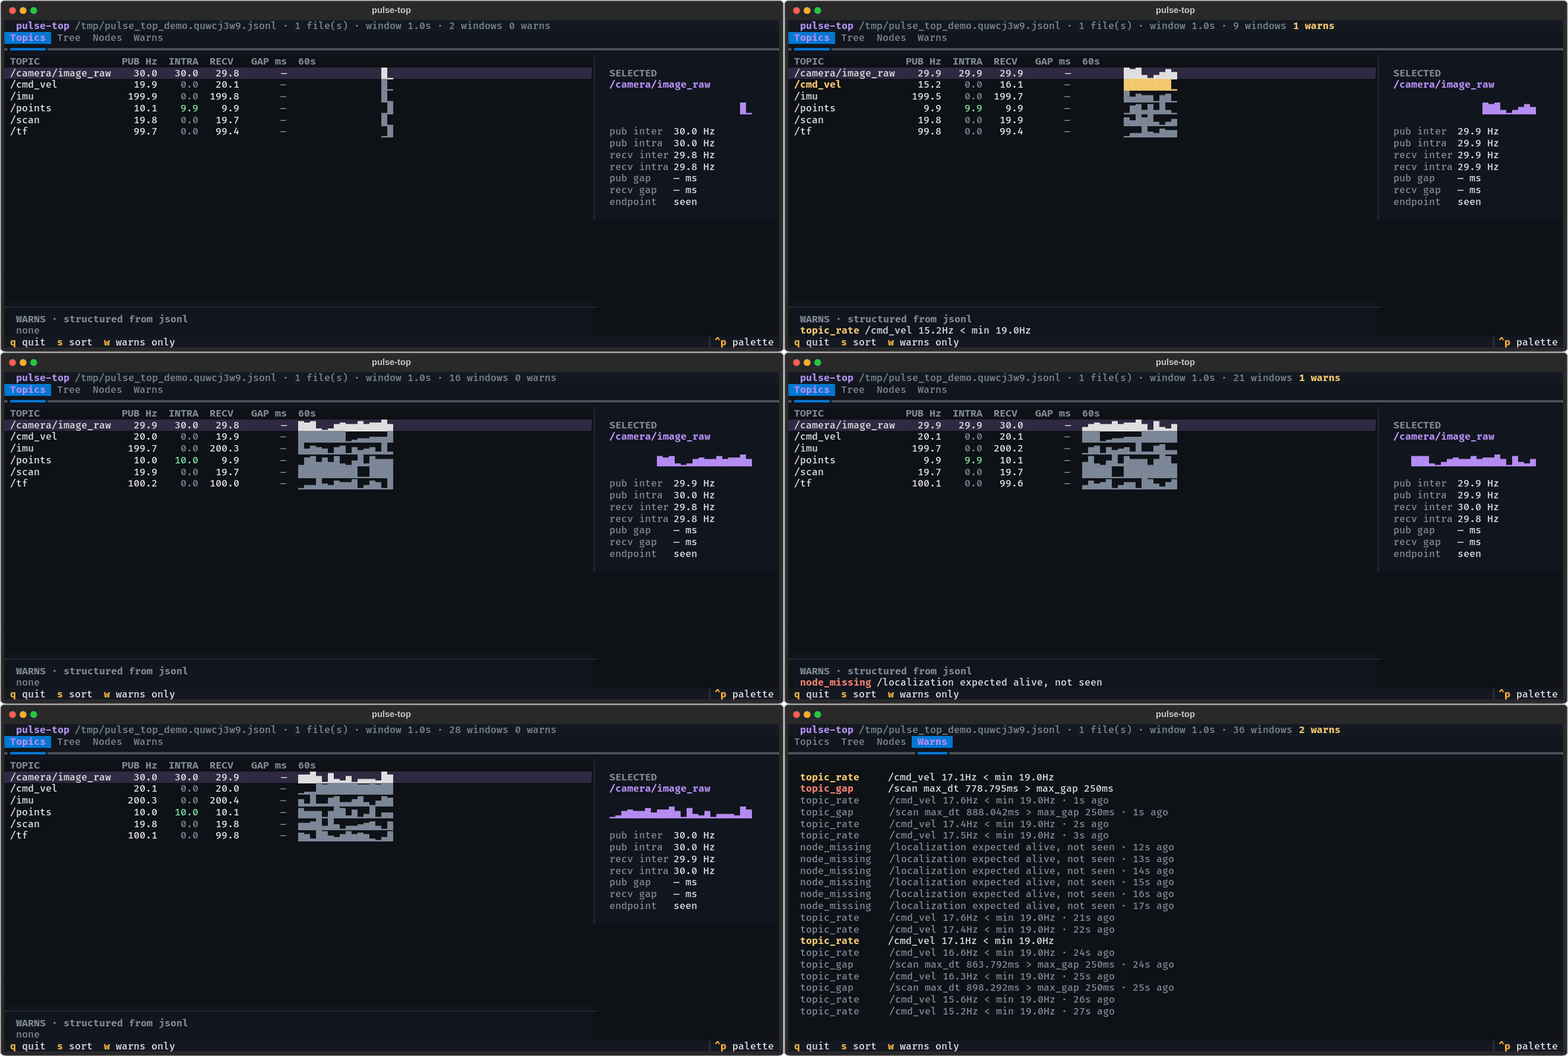
Live terminal dashboard over a ros2_pulse probe log. A pure log consumer:
no ROS dependency, no node, no subscriptions; it tails the log files the probe
already writes (the default text format or jsonl, both are read), so watching costs the robot nothing and works over plain ssh or on
a dead log after the incident.
That is the difference from graph-joining monitors (ros2top, ornis,
ros2_topic_monitor, ...): they join the graph to measure it; pulse-top reads
what the in-process probe measured, including the intra-process traffic no
graph-side tool can see.
Run
pip3 install ros2-pulse-top             # from PyPI; or from a checkout: pip install ./tools/pulse-top

# probe side: nothing extra, the default text format is read as is
LD_PRELOAD=libros2_pulse.so ros2 launch my_robot bringup.launch.py

# dashboard side (any shell, any machine with the file):
pulse-top                               # every $TMPDIR/topic_freq.<pid>.log (one per probed process)
pulse-top /path/to/shared.log           # one explicit file (e.g. a fleet-wide ROS_TOPIC_STATS_OUTPUT_FILE)
pulse-top '/var/log/topic_freq.*.log'   # a quoted glob; new files are picked up as nodes start
pulse-top --demo                        # self-generated demo graph with a scripted incident
pulse-top --theme light                 # black on white, for a light terminal or daylight
Both probe formats are read, per line, so a mix of text and jsonl files (or one file the
probe was restarted into with the other format) shows as one view. Until the first window
lands, a line under the top bar says why the table is empty: no file matches the glob yet,
N files found and waiting for the first window (one per ROS_TOPIC_STATISTICS_PUBLISH_PERIOD,
5 s by default), or which files match but are not probe output.
Colours
--theme picks the colours, and PULSE_TOP_THEME sets the default so it can live in
.bashrc next to the probe:
| Theme | Use |
|---|---|
dark |
the default, dark background |
light |
black on white, every warn colour chosen to read on white (outdoors, light terminals) |
terminal |
paints nothing: your terminal's own background, foreground and ANSI palette |
export PULSE_TOP_THEME=light
pulse-export: Prometheus, OTLP, Grafana
The same package installs pulse-export, which serves the same logs as Prometheus metrics
(stdlib only, no extra install):
pulse-export                                  # :9464/metrics over every $TMPDIR/topic_freq.<pid>.log
pulse-export --otlp http://localhost:4318     # also push OTLP/HTTP JSON
pulse-export --demo                           # the demo graph below, as metrics
A ready Prometheus + Grafana stack is in
examples/grafana/; metric reference in
docs/EXPORT.md.
Keys
| Key | Action |
|---|---|
↑/↓ |
select topic (detail sidebar follows) |
tab |
switch view: Topics · Tree · Nodes · Warns |
s |
cycle sort: topic / rate / gap |
w |
toggle warns-only filter |
q |
quit |
What it shows
- Topics: per-topic publish/intra/receive Hz, max inter-arrival gap, 60-window
sparkline. Absence renders as
—; the probe's "not measured" is never shown as 0. - Tree: topic namespace hierarchy with live rates.
- Nodes: liveness from
NODErecords; missing nodes flagged from structured warns. - Warns: the probe's warns (
topic_rate,topic_gap,node_missing), from the structured jsonlwarns[]or the textWARNlines, plus one pulse-top derives itself from two processes' windows:recv_lag, below.
Development
cd tools/pulse-top
uv venv .venv && uv pip install -p .venv/bin/python -e ".[dev]"
env -u PYTHONPATH .venv/bin/python -m pytest tests/   # clear ROS's pytest plugins
Reading a live stack (many processes, one view)
Every probed process flushes its own window; a 77-node stack is ~15 windows/s interleaved across files (or within one shared file). The view is built for that:
- Stale is measured in time, from the window timestamps: a topic is
stale 12sonce more than 1.5× its own window period has passed since its last window, regardless of how many other processes' windows landed in between. A 5 Hz topic on a 77-node stack used to readstale 3wfor that reason (Orin, 2026-08-23). - Sides merge. One process publishes
/tf_static, twenty receive it. A receive-only window refreshes theRECVfields and leavesPUBas learned from the publisher's window. - One sparkline sample per period, whichever process's window lands first in it.
- Only changed cells repaint. Textual's
DataTable.update_cellinvalidates and refreshes unconditionally; pulse-top diffs against what it last rendered, so an idle screen costs nothing over ssh.
transition_event, NITROS _supported_types and other one-shot topics going stale minutes
after startup is correct: they fired once.
recv_lag: callbacks under the publish rate
The one warn pulse-top derives itself. The probe cannot: each probed process reports only the
endpoints it hosts, so the publisher's process carries a topic's publish rate and the
subscriber's process carries its callback rate. pulse-top already merges the two sides per
topic (above); recv_lag compares them. Defaults are on, no configuration needed.
| field | meaning |
|---|---|
kind |
recv_lag |
topic |
the topic |
pub_hz |
publish rate paired with the window that fired: max(pub_inter_hz, pub_intra_hz), the probe's own busier-path rule (one publish() can fire both) |
recv_hz |
callback rate of that window: recv_inter_hz + recv_intra_hz (disjoint deliveries) |
deficit |
(pub_hz - recv_hz) / pub_hz |
windows |
consecutive lagging windows at fire time |
source |
the subscriber's log file (pulse-top only) |
Rules, applied to every window that carries a topic's receive side:
- The publish observation must be fresh: within 1.5 window periods of the receive window,
the same rule that marks a row stale. A publisher that stops publishing vanishes from its own
windows while the subscriber keeps reporting an explicit
0.0; that pair is a dead upstream, not lag, and it resets the streak. The two processes must also flush on comparable periods (within a factor of 1.5); otherwise nothing is compared, below. - A window is lagging when the deficit exceeds
--lag-tol(default0.10) and the shortfall exceeds two messages per window (one message can cross a window boundary from phase offset alone; at 1 Hz on 5 s windows that is a 20% swing). A shortfall inside that floor is healthy whatever the ratio says. --lag-windowsconsecutive lagging windows fire the warn (default3, which absorbs a subscriber's partial first window;0disables the detector). A deficit under half the tolerance, or a shortfall inside the two-message floor, clears it; a deficit between half the tolerance and the tolerance holds, so a topic hovering at the threshold neither flaps nor re-fires. A warn whose subscriber stopped flushing clears after 1.5 periods.- Trackers are keyed by topic and source file, so a healthy subscriber process and a lagging one do not reset each other. Receive above publish (two subscriptions in one process, two publishers) is never a warn.
The Warns tab and strip line, amber like topic_rate since it is an inference:
recv_lag /scan recv 12.0Hz < pub 20.0Hz (-40%, 3 windows) · callbacks see fewer than published; drop or backlog, probe cannot tell which
What recv_lag cannot tell you. The probe counts callbacks, not wire samples. A sustained
deficit means messages were published and did not reach this process's subscription callback at
the same rate. It cannot name which messages, cannot distinguish a QoS/history drop (best-effort
loss, KeepLast overflow at the reader) from an executor that is behind and overwriting its
buffer, and cannot see a process that is not probed. Sequence-number loss detection needs the
wire. Four further limits. With one shared log (ROS_TOPIC_STATS_OUTPUT_FILE set fleet-wide)
there is no per-process provenance, a healthy and a lagging subscriber alternate in one tracker
and the warn does not fire. On Humble an all-in-process intra topic has no publish-side rate,
so nothing is compared (Iron+ pairs pub_intra_hz with recv_intra_hz in the same window).
Both processes must run a comparable ROS_TOPIC_STATISTICS_PUBLISH_PERIOD, within a factor of
1.5: a publisher flushing every 5 s against a subscriber flushing every 1 s reads 100, 0, 0, 0,
0 on a healthy bursty pipe, so periods further apart than that are never paired. And windows
are ordered by time only within one poll: on attach to a large publisher log the follower
replays it 1 MiB per poll, so the subscriber's windows can pair against old publish timestamps
and the warn is delayed until the backlog drains.
The probe never writes recv_lag. Should a log-side tool (pulse-check, ROADMAP R1.1) emit it,
the reserved shapes are jsonl
{"kind":"recv_lag","topic":"/scan","pub_hz":20.000000,"recv_hz":12.000000,"deficit":0.400000,"windows":3}
and text WARN TOPIC /scan recv_hz=12.000000 pub_hz=20.000000 deficit=0.40 windows=3.