ros2_pulse
The heartbeat of your ROS 2 graph. A low-overhead probe that measures per-topic message rate and active-node liveness for both inter-process and intra-process traffic, on stock ROS 2 binaries, with no rebuild, no privileges and no network traffic. The counting hot path costs under a nanosecond per message; the whole probe costs about 2 % of workload CPU on a harsh 4,900 msg/s stress and less on real graphs.




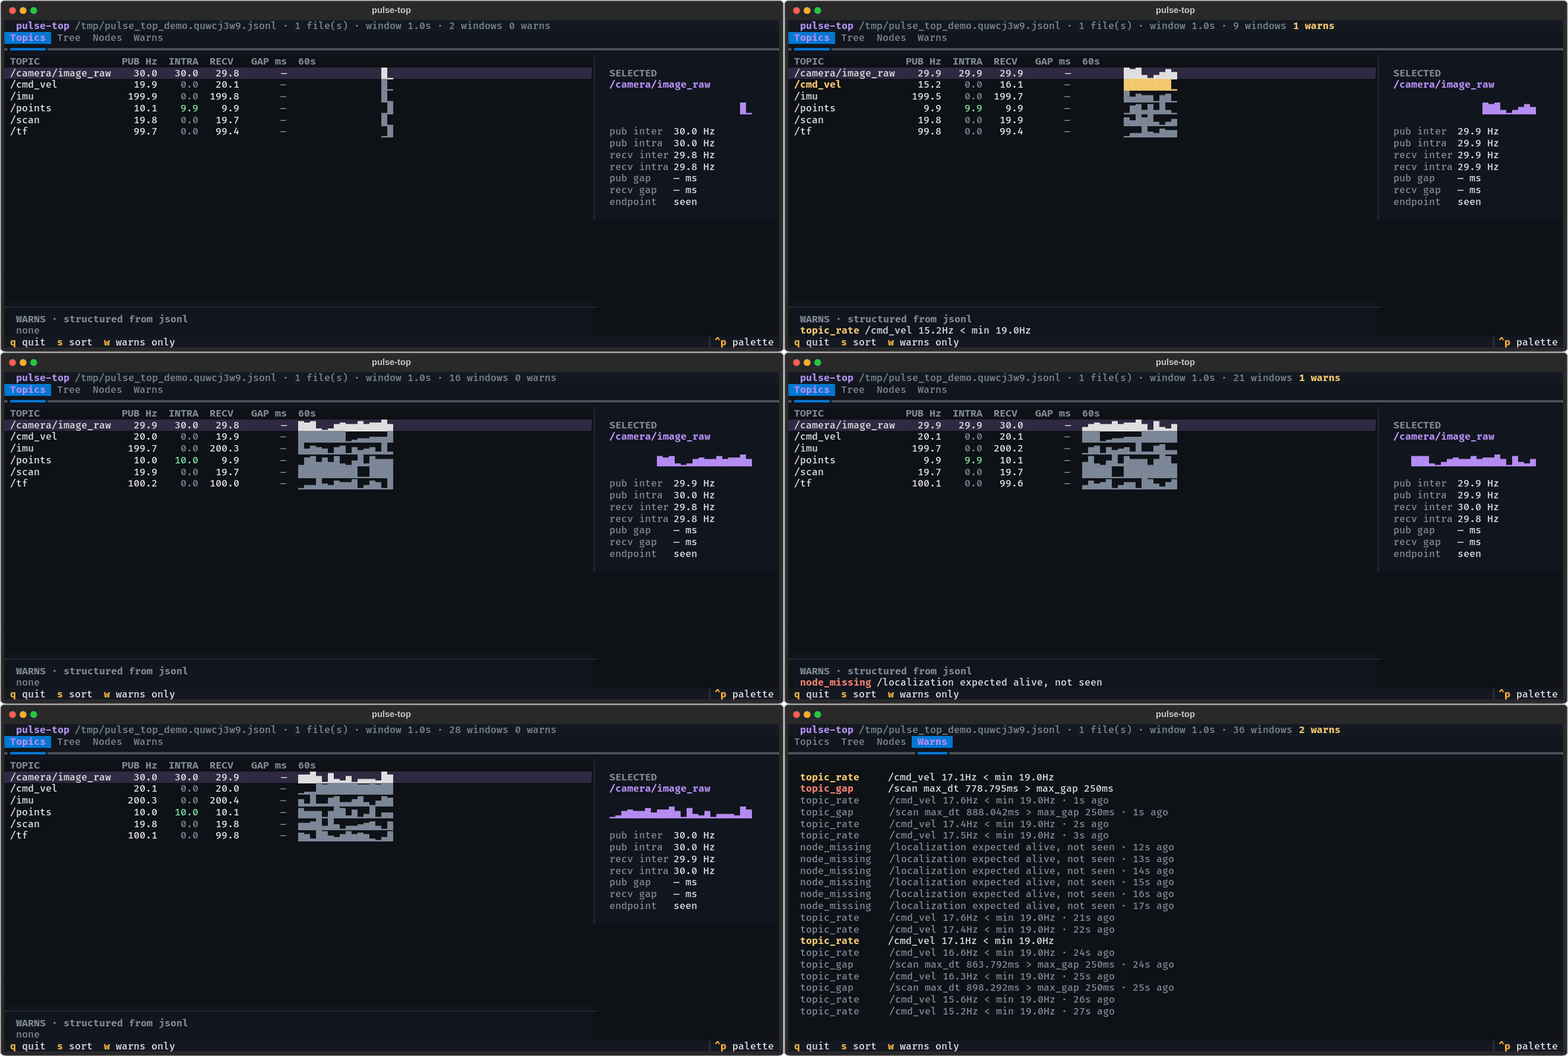
pulse-top --demo: the probe's log, live. Sparklines per topic, intra-process rates, structured warnings with ages. Install: pip3 install ros2-pulse-top (details).
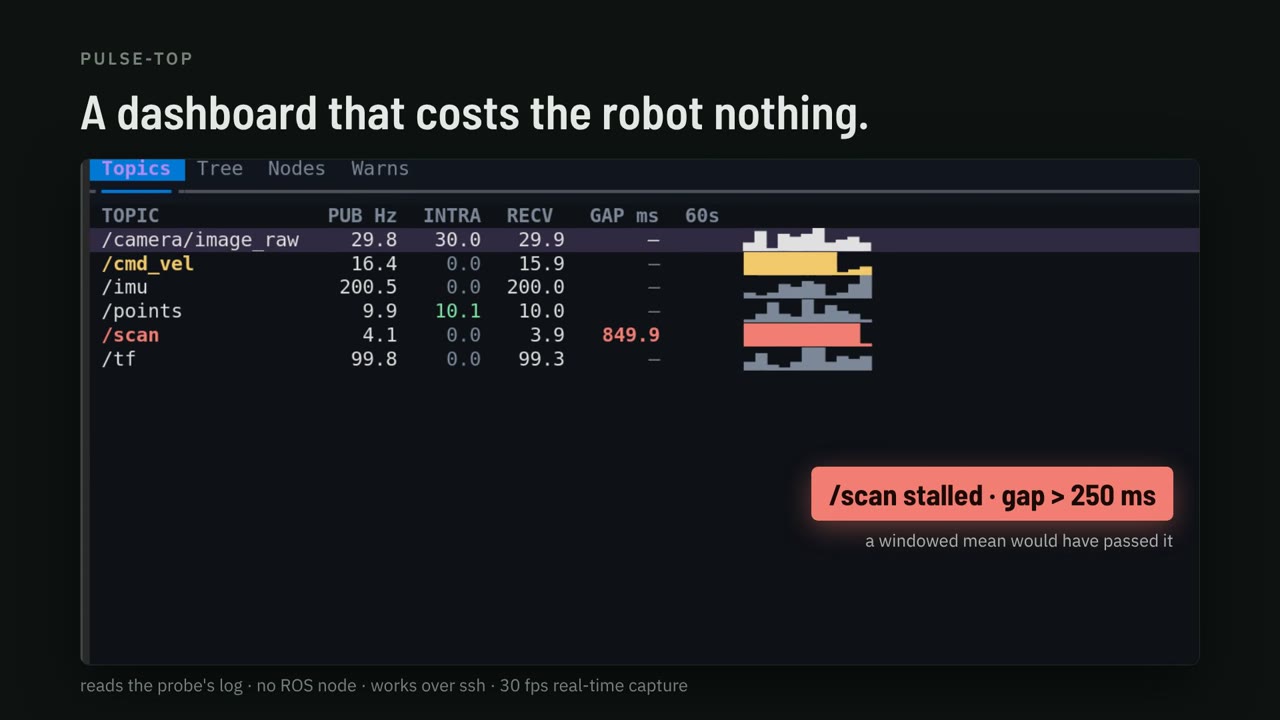
Forty seconds on what watching a topic costs and what the probe does instead. Watch the video (40 s, YouTube) or read the docs.
The long version, for systems programmers: Watching a ROS 2 topic changes it, the observer-effect measurement and the symbol-interposition trick that avoids it.
Why
The question in production is simple: is every topic flowing at the rate it should, and which nodes are alive? The existing tools each fall short of answering it.
ros2 topic hzandros2 topic echosubscribe to one topic at a time. Watching a single 100 KB topic costs 7 % of a core withhzand 31 % withecho, they cannot see intra-process messages at all, and pointinghzat an intra-process topic makes the publisher start serializing every message, which raised the watched process's CPU by 52 % in our measurements.- Built-in topic statistics are
bypassed by intra-process comms on Humble-class
binaries, so composable nodes carrying point clouds lose all introspection. This is fixed on
rollingand newer by rclcpp#3130 (merged April 2026); there is no public Humble backport as of this writing. ros2_tracing/ LTTng is built for offline analysis: a session daemon plus post-processing of a CTF trace just to get a rate. On Humble it also needs ROS rebuilt with the lttng-ust backend (Jazzy and newer trace out of the box).- CARET (Tier IV) uses the same hook layer as this probe, LD_PRELOAD over tracetools, which is a useful independent validation of the mechanism. It is built for deep offline latency and chain analysis and needs LTTng, a forked rclcpp and Jupyter post-processing. Complementary, not always-on.
- eBPF uprobes need
CAP_SYS_ADMIN, debugfs and a kernel with BTF and uprobes, which is often a non-starter on Jetson and other embedded targets, and they pay a kernel trap per message.
ros2_pulse hooks the tracetools instrumentation layer that rclcpp already calls on every
publish and every callback, counts in-process with a lock-free hot path, and writes ready-to-read
Hz to a small rolling file.
What you get
# ts_ns=1782887153899445923 window_s=5.000
TOPIC /scan 20.000000                      # publish-side, inter-process
PUB   /points inter=0.000000 intra=30.000000   # publish-side incl. intra (Iron+)
RECV  /scan inter=20.000000 intra=0.000000 # receive-side, BOTH transports
RECV  /points inter=0.000000 intra=30.000000   # <- intra-process, invisible to other tools on Humble
JITTER /scan recv max_dt_ms=21.284             # largest inter-arrival gap (opt-in, see below)
NODE  /perception
NODE  /planner
WARN  TOPIC /scan hz=1.200000 expected=[18,22]  # only with an expected-rate spec (see below)
If a sidecar exporter or a log shipper is reading instead of a person, ROS_TOPIC_STATS_FORMAT=jsonl
writes every window as one JSON object per line with the same gates and values. See
JSON Lines output. Dashboards that already
read rclcpp's built-in topic statistics get the same numbers on /statistics from the
pulse_bridge sidecar, and Prometheus, OTLP and
Grafana get them from pulse-export.
How it works
libros2_pulse.so is injected with LD_PRELOAD. It exports the same symbols as
libtracetools.so's tracepoint API (ros_trace_rcl_publish, ros_trace_callback_start, the
init tracepoints and so on). The dynamic linker binds rclcpp's calls to ours first; each
interposer records a stat and forwards to the real function through dlsym(RTLD_NEXT, ...).
rclcpp calls these functions unconditionally (the LTTng enable check is inside them), so the
probe works with no tracing session and adds no DDS traffic.
- Intra-process visibility comes from
callback_start(callback, is_intra_process), which fires for every subscription callback regardless of transport. - The hot path is a per-endpoint relaxed atomic increment behind a 256-slot thread-local cache with a stride-breaking hash. No global lock, no per-message string hashing. Counting costs about 0.3 ns/op on a fixed endpoint and 0.6 to 1.2 ns/op alternating across a working set on the reference box, two orders of magnitude under a single LTTng-UST tracepoint (about 158 ns).
- A background timer snapshots and resets the counts every
ROS_TOPIC_STATISTICS_PUBLISH_PERIODseconds and appends the rates toROS_TOPIC_STATS_OUTPUT_FILE.
The pure C++ core (core/) has no ROS dependency and is unit tested on its own; the probe layer
(probe/) is a thin LD_PRELOAD shim.
Install
apt
Binary packages are built for Humble, Jazzy and Kilted:
sudo apt update && sudo apt install ros-$ROS_DISTRO-ros2-pulse
Jazzy is in the main ROS 2 apt repository (synced 2026-09-11), so that line is all it needs.
Humble and Kilted are in ros2-testing and reach the main repository at their next sync; to
install them before that, add the testing repository first:
echo "deb http://packages.ros.org/ros2-testing/ubuntu $(. /etc/os-release && echo $UBUNTU_CODENAME) main" \
  | sudo tee /etc/apt/sources.list.d/ros2-testing.list
sudo apt update
From source
cd ~/ros2_ws/src && git clone https://github.com/TanayK07/ros2_pulse.git
cd ~/ros2_ws && colcon build --packages-select ros2_pulse && source install/setup.bash
pulse-top
The pulse-top dashboard installs separately, no ROS environment needed:
pip3 install ros2-pulse-top
Requires ROS 2 Humble, Jazzy or Kilted (all three are CI-tested on stock ros:<distro> images,
see Compatibility) and a libtracetools.so with instrumentation compiled in,
which is the default on stock and Isaac binaries. Verify with:
nm -D $(ros2 pkg prefix tracetools)/lib/libtracetools.so* | grep -c ros_trace
Usage
export LD_PRELOAD=libros2_pulse.so                      # resolved from the sourced workspace
export ROS_TOPIC_STATS_OUTPUT_FILE=/tmp/pulse.log       # default: $TMPDIR (or /tmp)/topic_freq.<pid>.log
export ROS_TOPIC_STATISTICS_PUBLISH_PERIOD=5.0          # seconds
export ROS_PULSE_EMIT_IDLE=1                            # optional; default 0, see below
ros2 launch your_stack your.launch.py
tail -f /tmp/pulse.log
ld.so warns and ignores it), so the variable is safe to
set fleet-wide.
Environment variables
| Variable | Default | Meaning |
|---|---|---|
ROS_TOPIC_STATS_OUTPUT_FILE |
$TMPDIR/topic_freq.<pid>.log (/tmp if TMPDIR unset) |
Where the stats file is appended. Per process by default; set an explicit path to share one file on purpose. The default open refuses symlinks (O_NOFOLLOW) because it lives in a world-writable directory; an explicit path may be a symlink. |
ROS_TOPIC_STATISTICS_PUBLISH_PERIOD |
5.0 |
Flush/snapshot window, in seconds. |
ROS_TOPIC_STATS_MAX_BYTES |
10485760 (10 MiB) |
Size cap: at or over it the file rotates to <path>.1 (single generation, worst-case disk = 2x cap per process). 0 disables rotation (pure append). The file is reopened per window, so external logrotate also works. |
ROS_TOPIC_STATS_JITTER |
0 |
When 1, measure per-endpoint inter-arrival gaps and emit a JITTER <topic> <side> max_dt_ms=... line for each side that saw traffic. Any max_gap_ms rule in the spec also switches it on, so a declared rule is never silently unchecked. Costs one clock read per message: +24 ns on x86-64, +51 ns on a Jetson AGX Orin, about 0.01 to 0.03 % of a core at 4,900 msg/s (measured). Opt-in for that reason. |
ROS_PULSE_EMIT_IDLE |
0 |
When 1, also emit a TOPIC /x 0.000000 line for a declared but silent topic (no traffic in the window). By default such topics are omitted so a large graph is not padded with a zero line per silent topic every window. Only the publish-side TOPIC line is affected: RECV emits an explicit 0.000000 line for topics that have delivered at least once (so a stalled upstream stays visible) and omits never-active topics. |
ROS_TOPIC_STATS_EXPECTED |
unset | Path to an expected-rate spec (below). When set, each window is checked at flush time and violations are appended as WARN lines. Unreadable or malformed specs warn once on stderr and disable alerting; they never crash the host. |
ROS_TOPIC_STATS_QUIET |
0 |
When 1, suppress the [ros2_pulse] active stderr banner, for deployments that parse the wrapped process's stderr. Only the informational banner is silenced. Error diagnostics (unreadable, malformed or zero-rule spec, unwritable output file) still print, because each of those disables something you configured, and silently disabled alerting is the 0.2.0 bug class this flag must not bring back. |
ROS_TOPIC_STATS_FORMAT |
text |
Output encoding: text (the block format above, byte-identical to previous releases) or jsonl (one JSON object per window per line, see below). Any other value warns once on stderr and falls back to text; it never crashes the host. pulse-check reads both. |
JSON Lines output (ROS_TOPIC_STATS_FORMAT=jsonl)
For sidecar exporters (Prometheus, OpenTelemetry) and log shippers: each flush window becomes one
JSON object on one line, \n-terminated, UTF-8 (jsonlines.org), so
tail -f pulse.log | jq . works as is. Same emit gates, same values, same precisions as the text
format; only the encoding changes.
{"ts_ns":"1782887153899445923","window_s":5.000,"topics":[{"topic":"/scan","pub_inter_hz":20.000000,"pub_intra_hz":0.000000,"recv_inter_hz":20.000000,"recv_intra_hz":0.000000,"recv_endpoint_seen":true,"recv_max_dt_ms":21.284}],"nodes":["/perception"],"warns":[{"kind":"topic_rate","topic":"/scan","hz":1.200000,"min_hz":18,"max_hz":22}]}
Schema rules, pinned by golden-byte unit tests:
ts_nsis a decimal string, not a JSON number. Epoch nanoseconds (about 1.8e18) exceed 2^53-1, so a number would silently lose the low digits in every IEEE-754 double consumer (JavaScript,jq). OTLP/JSON encodestimeUnixNanoand every (u)int64 field the same way.- An absent key means "not measured", never 0.
pub_*/recv_*pairs appear only when the matching text line would, andpub_max_dt_ms/recv_max_dt_msonly when gap tracking measured that side (ROS_TOPIC_STATS_JITTER). A missing gap is unknown, not "perfectly smooth". topics,nodesandwarnsare always present (empty arrays when empty), so.warns[]needs no null guards.warnsare structured (kindistopic_rate,topic_gapornode_missing, with the numbers as JSON numbers) rather than preformatted strings. An unboundedmax_hzomits the key, since JSON has noInfinity. The textWARNline is a rendering of the same data.pulse-top'srecv_lag(callbacks under the publish rate, compared across two processes' windows) is derived by that consumer and never written by the probe.- Topic and node names are escaped per RFC 8259, so a hostile name cannot break the one-object-per-line framing.
pulse-check sniffs the format per line (a { first byte can only be a jsonl record), so
watchdog and CI gating work unchanged on jsonl logs. A file of non-probe JSON still exits 2
(no probe windows) rather than passing.
Publishing on /statistics (pulse_bridge)
If something already consumes rclcpp's built-in topic statistics, pulse_bridge republishes the
probe's windows there: one statistics_msgs/MetricsMessage per topic per window, in the same
shape (unit ms, AVERAGE = message period, SAMPLE_COUNT = messages in the window,
MAXIMUM = largest inter-arrival gap when jitter tracking is on). Intra-process topics
included, which is what the built-in statistics cannot report on Humble
(rclcpp#2911).
# Probed processes write jsonl (the bridge reads line by line; text windows span lines).
export ROS_TOPIC_STATS_FORMAT=jsonl
LD_PRELOAD=$(ros2 pkg prefix ros2_pulse)/lib/libros2_pulse.so ros2 launch my_robot bringup.launch.py

# One sidecar per machine. Follows $TMPDIR/topic_freq.*.log by default and picks up
# processes that start later.
ros2 run ros2_pulse pulse_bridge
ros2 topic echo /statistics
It is a separate process on purpose. The probe stays out of the DDS graph and never links rclcpp, so watching the numbers still cannot perturb them; what joins the graph is one small message per topic per window from a process that is not the one under test.
| Parameter | Default | Meaning |
|---|---|---|
files |
[] |
Explicit log paths to follow. |
glob |
$TMPDIR/topic_freq.*.log |
Re-expanded on every poll, so a probed process that starts later is picked up. |
topic |
/statistics |
Where to publish. |
unit |
ms |
ms: AVERAGE is the message period (built-in convention). Hz: AVERAGE is the rate, no MAXIMUM. |
poll_period_s |
1.0 |
How often the logs are read. |
source_name |
"" |
measurement_source_name. Empty: the window's single node name, or ros2_pulse when the process has several. |
The rate is taken at the subscription when the process has one (what the built-in statistics measure) and at the publisher otherwise. Inter- and intra-process paths report the busier of the two, not the sum: one publish can hit both tracepoints. A text-format log is refused with one warning per file.
Prometheus, OTLP and Grafana (pulse-export)
pulse-export ships with pulse-top (pip3 install ros2-pulse-top) and serves the probe's logs
(text or jsonl) as Prometheus metrics on :9464/metrics (per-topic publish and callback rates, gaps,
recv_lag, warns, node liveness, per-process window age), optionally pushing the same series
over OTLP/HTTP (--otlp http://collector:4318). Standard library only, no ROS dependency, no
graph presence. To see a probed robot on a Grafana dashboard:
docker compose -f examples/grafana/docker-compose.yml up --build # then open http://localhost:3000
Metric names, labels and staleness rules: docs/EXPORT.md.
Expected-rate alerting
Declare what "healthy" means and let the probe say when reality disagrees, for the whole process
tree at once and without per-node diagnostic_updater code:
# /etc/pulse/expected.yaml, a documented YAML subset (flow-map topic rules; no YAML lib in the probe)
topics:
  /scan:   {min_hz: 18, max_hz: 22, side: recv}   # side: pub|recv (default recv)
  /scan:   {min_hz: 18, side: pub}                # same topic, other end, allowed
  /points: {min_hz: 25, transport: intra}         # transport: inter|intra|any (default any)
nodes: [/perception, /planner]                    # expected alive
transport: any is the topic's rate however it travels. On the receive side the two buckets are
disjoint deliveries, so they are summed. On the publish side one publish() can fire both the
intra-process and the RMW tracepoint for the same message (Iron and newer, and always under
TransientLocal QoS on Jazzy and newer), so the larger bucket is used rather than the sum.
export ROS_TOPIC_STATS_EXPECTED=/etc/pulse/expected.yaml
Violations render inside the normal window block. They are additive, so existing parsers are unaffected:
WARN TOPIC /scan hz=1.200000 expected=[18,22]
WARN NODE /planner missing
Catching stalls a rate bound cannot see
A windowed mean cannot detect a freeze. At 50 Hz with min_hz: 45 and the default 5 s window,
the rule fires only below 225 messages, which is more than half a second of dead time. A 400 ms
freeze, 20 lost cycles and catastrophic for a control loop, reports 46 Hz and passes. Widening
the window makes it worse: the same 2 s stall at a 20 s window averages to exactly 45.0 Hz and
never fires. One 500 ms freeze and 500 spread-out 1 ms hiccups both read 45.0 Hz.
max_gap_ms bounds the largest inter-arrival gap instead, which does not depend on the window
length:
topics:
  /scan:    {min_hz: 45, max_gap_ms: 60, side: recv}   # too slow AND frozen are different faults
  /cmd_vel: {max_gap_ms: 30, side: pub}                # gap-only rules are valid on their own
WARN TOPIC /scan max_dt_ms=812.400 expected_max_gap_ms=60
A rule may violate the rate bound and the gap bound independently, producing two lines. Setting
max_gap_ms turns measurement on by itself; you do not also need ROS_TOPIC_STATS_JITTER=1.
This also covers control loops driven by rclcpp::Rate or a raw sleep_until rather than a
timer (ros2_control, Nav2, MoveIt Servo): they publish, so their stalls show up here.
A gap is reported in every window it is open in and in the window where the next message
arrives, so a silent topic's gap grows window by window and a max_gap_ms rule fires while it
stays silent (a min_hz rule fires on the 0 Hz as well). If the whole probed process freezes
(SIGSTOP, a debugger, a VM pause) its flush thread freezes too, so nothing is written during the
stall; the first window after it resumes is one long window (its window_s spans the stall) that
carries the full gap, and the cadence restarts from there. Watch window age from outside
(pulse-top, pulse-export) to see a process that is frozen right now.
Evaluation happens only at flush time (the hot path never sees the spec) and each probed process only judges endpoints it hosts. The first window (attach ramp-up) and the final atexit window (a sub-period sliver whose rate is a one-sample estimate) are skipped, so a healthy start or stop never raises an alert. Their rates are still logged.
pulse-check turns any log, or a set of per-process logs, into an exit code for watchdogs,
systemd or CI. It re-derives the verdict from the raw rates of the last window and needs no ROS:
# live watchdog: the last window IS the current state
pulse-check --spec /etc/pulse/expected.yaml /tmp/pulse.*.log && echo healthy

# post-run CI gate: the stack has exited, so skip its atexit window
pulse-check --spec /etc/pulse/expected.yaml --skip-last /tmp/pulse.*.log

# exit 0: pass   1: violations (printed)   2: bad input
# a max_gap_ms rule whose logs carry no JITTER line is exit 2, not a pass: the check could not
# be performed, and reporting that as healthy would be wrong. Measured violations still print.
# offline it owns the whole picture: a spec topic in NO log is reported at 0 Hz
Use --skip-last on logs from a stack that has already stopped: the probe's final window is the
atexit flush, a sub-period sliver whose rate is a one-sample estimate, so gating on it can go red
on a healthy shutdown. It needs at least 2 windows per log (3 to also clear the ramp-up window).
Receive rates sum across logs, so max_hz belongs on side: pub: K subscriber processes on one
topic legitimately report K times the publish rate.
Benchmarks
Measured in ros:humble, ros:jazzy and ros:kilted containers with a workload of about
4,900 msg/s across 53 mixed topics (30 light at 100 Hz, 8 heavy of about 100 KB at 50 Hz
inter-process, 15 intra-process at 100 Hz), a harsh stress by design. Paired, order-alternated
trials (N=10 per distro) with error bars; the harness and method are in bench/.
| Method | CPU overhead | Monitor's own cost | Disk | Intra-proc | Stock binaries | Privileges |
|---|---|---|---|---|---|---|
| ros2_pulse | about +2 % at worst-case stress (pooled +1.9 % ± 0.7 % across humble/jazzy/kilted; about 1 µs/msg all in) | in-process | about 22 KB rolling | yes | yes | none |
| eBPF uprobe | noise at this rate¹ | bpftrace process | 0 | yes | yes | CAP_SYS_ADMIN + BTF |
| LTTng / ros2_tracing | captured 0 events on stock binaries² | daemons | CTF (large) | yes | needs rebuild | sessiond |
The counting hot path measures about 0.3 ns/op warm-cache and 0.6 to 1.2 ns/op alternating
endpoints, two orders of magnitude under one LTTng-UST tracepoint (about 158 ns). The
end-to-end 2 % is the diffuse footprint of observing at all (chained tracepoints, cache and TLB
residency), attributed by controlled experiments in bench/RESULTS.md.
Real graphs with lower aggregate rates see proportionally less.
¹ A uprobe is a per-event kernel trap of about a microsecond and grows with message rate.
² Stock libtracetools.so is not always linked to lttng-ust; then the tracepoints are no-ops.
See bench/RESULTS.md.
On a Jetson AGX Orin (aarch64, L4T R36.4, a production 77-node Humble/CycloneDDS stack) the
probe loads into every process on the stock deployed binaries, opens 0 sockets, and the hot path
measures 0.9 ns/op fixed and 2.1 ns/op alternating. The opt-in jitter clock read costs
+51 ns/msg ± 0.6 (vs +24 on x86). The CLOCK_MONOTONIC vDSO works on this kernel; the
difference is a slower clock, not a syscall fallback. Raw trials and the redacted production log
are in test/orin/RESULTS.md.
Limitations
- On ROS 2 Humble there is no intra-process publish tracepoint, so intra rate is measured
receive-side (per subscription), which is usually the signal you want. On Iron and newer the
probe also hooks
rclcpp_intra_publishand emits an additivePUBline with publish-side intra rates. - Node liveness is traffic-derived. There is no node-teardown tracepoint on stock Humble, so a
node appears in the
NODElines only while a topic it publishes or subscribes to has carried traffic within the last few windows; a node silent for several windows is treated as quiet and drops out. A live but idle node (a pure timer or service node with no topic traffic) therefore reads as quiet. Re-initialising a node name does not duplicate its entry. - Requires tracing instrumentation compiled into the ROS build (the default on Humble and Isaac
debs; checkable at runtime with
ros_trace_compile_status()). - Python (rclpy) nodes are counted on the publish side only.
rcl_publishfires in the C layer, so Python publishers are counted, butcallback_startis rclcpp-only and rclpy was never instrumented (ros2_tracing#15), so a Python subscriber's deliveries do not appear inRECVlines. - File output only; no live network export, by design.
Compatibility
| Distro | Status | Notes |
|---|---|---|
| Humble (LTS, EOL 2027) | CI-tested | tracetools ships without the LTTng backend, the case where this probe is the only zero-rebuild option |
| Jazzy (LTS, EOL 2029) | CI-tested | full suite green on stock ros:jazzy; tracetools is LTTng-enabled and the probe forwards, so a live tracing session coexists |
| Kilted | CI-tested | full suite green on stock ros:kilted |
| Rolling | non-blocking CI lane | observational, watches upstream churn |
| Iron | not targeted | EOL December 2024 |
On Iron and newer the probe additionally hooks the dedicated rclcpp_intra_publish tracepoint,
so publish-side intra rates appear on an additive PUB line. On Humble intra stays receive-side
because the tracepoint does not exist there.
Middleware (RMW) matrix
The hooks bind above the rmw layer (rclcpp and rcl call the tracetools functions before any
middleware sees the message), so the probe should be RMW-agnostic by construction. "Should" is
not a support claim, so every row below is measured by test/rmw/run_rmw_matrix.sh <distro>
(one command, re-runnable): talker and listener as separate processes plus an intra-process node,
probe preloaded, and publish-side TOPIC, receive-side RECV inter and RECV intra each
asserted at the nominal 50 Hz ±30 % with the same parser the CI accuracy suite uses. Evidence
(probe logs, per-process stderr, daemon logs, exact deb versions) lands in test/rmw/out/.
All four configurations passed on ros:humble, ros:jazzy and ros:kilted on 2026-08-08. The
quoted rates are from the jazzy run; humble and kilted matched within ±0.1 Hz (full per-distro
logs under test/rmw/out/):
| RMW | Status | Evidence |
|---|---|---|
rmw_fastrtps_cpp (the default on all three distros) |
CI-tested | every integration lane runs it; kept as the matrix control leg. TOPIC 50.007 / RECV inter 50.002 / RECV intra 50.055 Hz |
rmw_cyclonedds_cpp |
validated | rmw 1.3.4 (humble) / 2.2.3 (jazzy) / 4.0.2 (kilted), cyclonedds 0.10.5. TOPIC 50.022 / RECV inter 50.020 / RECV intra 50.019 Hz |
| CycloneDDS + iceoryx SHM | validated¹ | iceoryx-posh 2.0.5 to 2.0.6: iox-roudi up, <SharedMemory><Enable>true</>, fixed-size UInt64 pair (String is not SHM-eligible). TOPIC 50.002 / RECV inter 50.002 Hz |
rmw_zenoh_cpp (no DDS in the process at all) |
validated | rmw-zenoh-cpp 0.1.9 (humble) / 0.2.9 (jazzy) / 0.6.6 (kilted, Tier 1 there; the default RMW everywhere is still FastDDS), rmw_zenohd router up for discovery. TOPIC 50.000 / RECV inter 50.001 / RECV intra 50.055 Hz |
¹ What the SHM run proves: both processes attach to RouDi (roudi.log), CycloneDDS creates
iceoryx endpoints for the measured topic in both processes (Writer's/Reader's topic name will
be DDS:Cyclone:rt/chatter_fixed in the per-process Tracing shm logs), and the probe reads
50 Hz on both sides throughout. Per-sample SHM-versus-loopback attribution is internal to
Cyclone (stock images ship no scriptable iceoryx introspection), so that residual is stated
rather than papered over. The claim under test, that the probe's numbers are transport
independent, holds either way.
Contributing
See CONTRIBUTING.md. Issues and PRs welcome.
License
Apache-2.0. See LICENSE.