Watching a ROS 2 topic changes it
Tanay, 2026-09-18
The question I wanted answered on a robot is small: is every topic flowing at the rate it should, and is every node still alive? In ROS 2 a topic is a named publish/subscribe channel and a node is a participant that publishes or subscribes to some of them. Messages travel over DDS, a discovery-based middleware, unless publisher and subscriber sit in the same process, in which case rclcpp (the C++ client library) can hand the message across a ring buffer without serializing it at all.
The obvious tool is ros2 topic hz. It subscribes to the topic, counts arrivals and prints an
average. That is the problem in one word: subscribes. The tool is a participant in the graph
it measures: it joins DDS discovery, matches with the publisher, and receives and deserializes
every message to count it. ros2 topic echo does the same and prints the contents. Both watch
one topic per invocation, and neither can see intra-process traffic, because a message that
never touches the middleware never reaches them.
What a subscriber costs
I measured it. The harness is
bench/run_observer_effect.sh: a stock ros:humble
container, CycloneDDS, on a 16-core AMD Ryzen 7 7435HS. The workload is a stress farm of 30
light topics at 100 Hz and 8 heavy topics (about 100 KB each) at 50 Hz between processes, plus
15 intra-process topics at 100 Hz inside one process, all with subscribers. Four arms rotate
each trial so warm-up and drift cancel: nothing watching, ros2 topic hz /heavy_0,
ros2 topic echo /heavy_0 > /dev/null, and ros2 topic hz /intra_0. Ten trials, ten-second
runs, the watcher attached for eight of them. The probe described below runs in every arm as
the ruler: it counts publish calls inside the publishing process, so its rate is the true one
whatever else is subscribed.
First finding: the CLI is accurate. The publisher held 50.000 Hz in every arm and hz printed
49.845 ± 0.053. I expected a slow reliable reader of 100 KB messages to back-pressure the
writer; on this box at this load it did not.
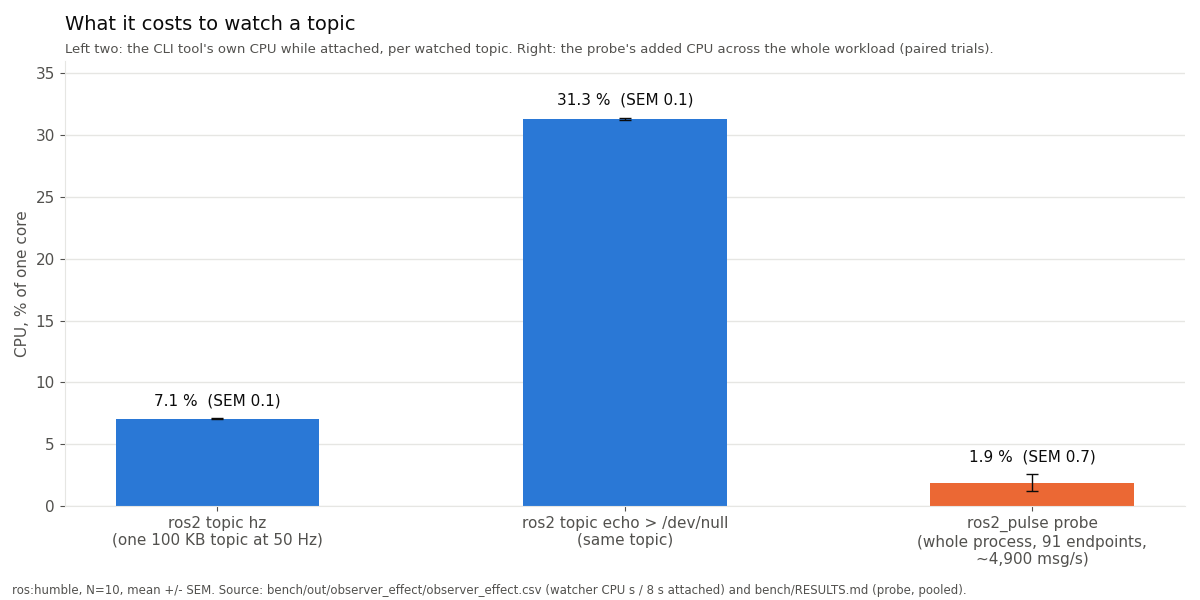
Second: it is not free. hz on one 100 KB topic used 0.566 s ± 0.005 of CPU over its 8 s,
which is 7.1 % of a core. echo on the same topic with its output discarded used
2.504 s ± 0.007, or 31.3 % of a core. Per topic, for as long as you look. The publisher farm's
own CPU did not move measurably with one more inter-process reader.
The surprise
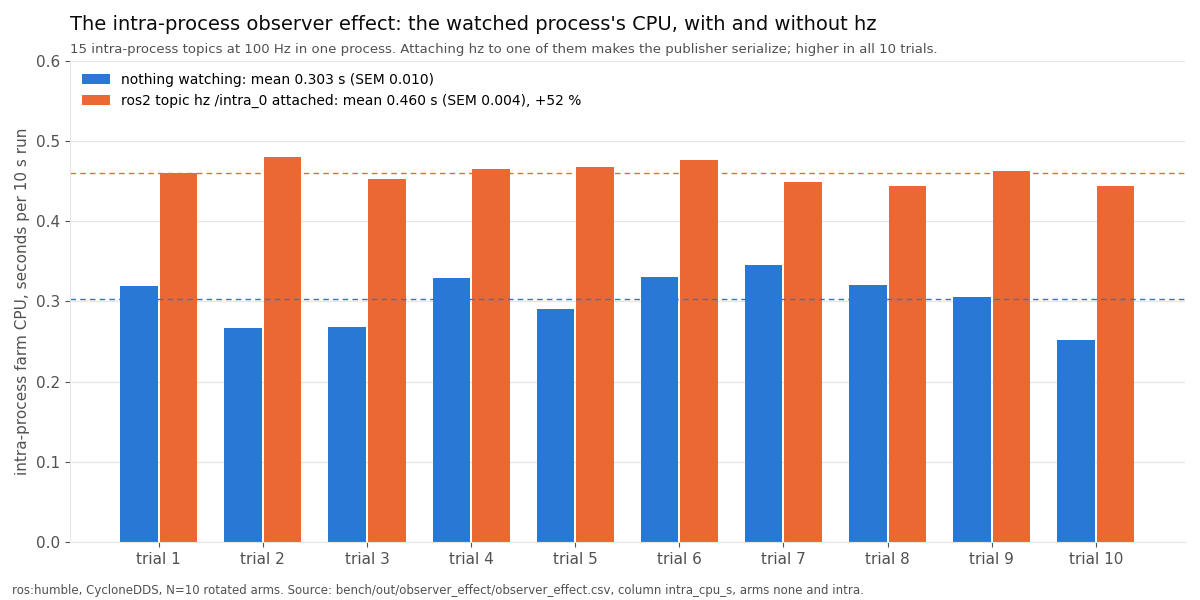
The fourth arm points hz at an intra-process topic. The intra-process farm (one process, 15
topics at 100 Hz) used 0.303 s ± 0.010 of CPU per run with nothing watching, and
0.460 s ± 0.004 with hz attached to one of its fifteen topics. That is +52 %, and every one
of the ten watched runs was higher than every one of the ten unwatched runs.
With intra-process communication enabled,
rclcpp's publish path compares the topic's subscription count with its intra-process
subscription count. When they match, the message goes into the intra-process manager's buffer
and is delivered by pointer; serialization and the DDS write are skipped, and rcl_publish,
the C-layer function that hands a message to the middleware, is never called. The moment an
external subscriber matches, the counts differ. From then on every message is also serialized
and written to DDS for the newcomer. The watched process does work it never did before, on
every message, for as long as the watcher is attached.
The probe made this visible. The publish-side rcl_publish tracepoint for /intra_0, which
never fires with nothing attached, lit up in 4 of the 5 two-second windows of each run (the
first window is mostly over before the watcher attaches), in 10 trials out of 10. And hz
reported 99.997 Hz, which is right. The number is correct; the system it describes is no
longer the one that was running before you looked.
Counting without subscribing
The way out is to count where the message already is: inside the publishing process, on a call path that every publish and every callback goes through anyway.
ROS 2 ships an instrumentation layer called tracetools. rclcpp and rcl call functions named
ros_trace_rcl_publish, ros_trace_callback_start and so on at the corresponding points;
these are the hooks that LTTng-based tracing (ros2_tracing) records from. They are
ordinary exported functions in libtracetools.so, called
unconditionally; the "is a tracing session active" check lives inside the function. And on
stock Humble debs, libtracetools.so is not linked against lttng-ust at all, so the functions
are no-ops that are still called on every message.
LD_PRELOAD loads a shared object before all others, and the dynamic linker binds each symbol
reference to the first definition it finds in load order. So a shim that exports its own
ros_trace_rcl_publish receives every call rclcpp makes, does its counting, and forwards to
the original, which it locates once with dlsym(RTLD_NEXT, ...): the next definition after
mine in load order. That is the whole probe:
// src/probe/interposers.cpp, trimmed
template <typename Fn>
auto realFn(const char* name) -> Fn {
    return reinterpret_cast<Fn>(dlsym(RTLD_NEXT, name));  // libtracetools' own definition
}

extern "C" {

ROS2_PULSE_EXPORT void ros_trace_rcl_publish(const void* pub_handle, const void* message) {
    ProbeRuntime::instance().registry().onPublish(pub_handle);   // one relaxed fetch_add
    static auto fn = realFn<void (*)(const void*, const void*)>("ros_trace_rcl_publish");
    if (fn) fn(pub_handle, message);                             // forward; a no-op on stock Humble
}

ROS2_PULSE_EXPORT void ros_trace_callback_start(const void* callback, bool is_intra_process) {
    ProbeRuntime::instance().registry().onCallbackStart(callback, is_intra_process);
    static auto fn = realFn<void (*)(const void*, bool)>("ros_trace_callback_start");
    if (fn) fn(callback, is_intra_process);
}

}  // extern "C"
callback_start is the intra-process answer: it fires for every subscription callback
regardless of transport and carries an is_intra_process flag, so a message that skipped DDS
is still counted, at the receiver, with no change to how it was delivered. The init
tracepoints (rcl_node_init, rcl_publisher_init, rcl_subscription_init and two rclcpp
ones) are hooked as well; they fire rarely and map opaque handles to topic names.
Hot-path resolution goes through a 256-slot thread-local cache keyed by handle. A hit is one
fetch_add with memory_order_relaxed on the endpoint's counter; a miss takes a shared lock;
only the first sighting of a callback takes the write lock. There is no global mutex and no
string hashing per message.
A timer thread wakes every few seconds (ROS_TOPIC_STATISTICS_PUBLISH_PERIOD, default 5),
swaps every counter to zero with exchange, divides by the window and appends a block of text
or one JSON line to a file. Nothing joins the DDS graph and no socket is opened.
One detail matters for something that gets preloaded into every process on a robot: the shim
must not leak symbols. The library is compiled with -fvisibility=hidden, the interposers
carry visibility("default") explicitly, and a linker version script keeps the dynamic symbol
table to exactly that contract:
{ global: ros_trace_*; local: *; };
The version script exists because libstdc++ headers force some template instantiations back to default visibility; an integration test pins the exported set.
What it costs
The probe's cost is measured the same way, with error bars. A single ten-second sample of this workload swings about ±4 % run to run, enough to fake or hide a 2 % effect, so the overhead harness runs baseline and probe back to back in each trial with the order alternated every trial, and reports the mean of the per-trial differences with its standard error. A difference counts as real only if it clears about twice the SEM. A fixed arm order with N=6 misled me once, which is why the protocol is written down.
On the same stress farm, about 4,900 messages per second across 91 endpoints and three processes, the pooled result over Humble, Jazzy and Kilted (N=10 per distro) is +0.049 s ± 0.018 on roughly 2.5 s of workload CPU, or +1.9 % ± 0.7 %. Per message that is about 1 µs added against the roughly 51 µs the stack already spends delivering it.
The counting itself is not where that goes. In a microbenchmark with eight threads, a warm-cache hit costs 0.3 ns per operation on x86-64, and 0.6 to 1.2 ns when each thread alternates across four endpoints. On a Jetson AGX Orin (Cortex-A78AE at 2.2 GHz) it is 0.9 ns fixed and 2.1 to 2.2 ns alternating, measured on a production 77-node Humble stack, on the deployed binaries, with zero sockets opened. The residual 2 % is diffuse: the chained call into the real tracepoint, extra code and data resident in cache and TLB across 16 executor threads, one parked flush thread. A null shim with the same eight exported symbols and empty bodies measured 0.3 % below baseline, so the interposition itself is free. I report the 2 % rather than subtracting it.
Limits
This is a counter, not a tracer. It reports rates and largest inter-arrival gaps per window,
not per-message loss and not latency. It needs the tracepoints compiled into the ROS build,
the default on stock debs; nm -D on libtracetools.so shows whether they are there. Python nodes are counted on the publish side
only, because rcl_publish fires in C under rclpy but callback_start is emitted by rclcpp,
and rclpy was never instrumented. On Humble there is no intra-process publish tracepoint, so
intra-process rate is measured at the receiver. The observer-effect numbers are one box, one
distro, one RMW, 100 KB messages at 50 Hz; a slower CPU, bigger messages or several watchers
scale the watcher's cost without changing the first finding.
What exists now
The probe is ros2_pulse, Apache-2.0:
apt install ros-$ROS_DISTRO-ros2-pulse (Jazzy from the main ROS 2 repository, Humble and
Kilted from ros2-testing until the next sync). pulse-top
(pip install ros2-pulse-top) is a terminal dashboard over the log, with a recv_lag warn
when a subscriber's callback rate falls under the publish rate for several windows.
pulse_bridge republishes the
windows on /statistics in the shape of rclcpp's built-in topic statistics, from a separate
process, so existing dashboards get intra-process rates too. The design notes
and the alternatives survey cover what built-in statistics, LTTng, CARET
and eBPF uprobes each give up.
Reproduce it
The observer-effect run is one command in a stock container:
docker run --rm -v "$PWD":/pkg -v /tmp/oe:/work ros:humble-ros-base \
  bash /pkg/bench/run_observer_effect.sh
It builds the probe and stress nodes, runs the four arms ten times, and writes the CSV,
evidence and summary to /tmp/oe. The tables, the paired-overhead
protocol and the hot-path microbenchmarks are in bench/RESULTS.md;
the figures above are
bench/plot_observer_effect.py over the committed raw
CSV.